3QFY2017 Result Update | Banking
February 13, 2017
ICICI Bank
ACCUMULATE
CMP
`282
Performance Highlights
Target Price
`315
Particulars (` cr)
Q3FY17
Q2FY17
% chg (qoq)
Q3FY16
% chg (yoy)
Investment Period
12 Months
NII
5,364
5,253
2.1
5,453
(1.6)
Pre-prov. profit
5,525
10,636
(48)
6,560
(15.8)
Stock Info
PAT
2,442
3,103
(21.3)
3,018
(19.1)
Source: Company, Angel Research
Sector
Banks
Market Cap (` cr)
1,63,997
ICICI Bank’s 3QFY17 results were in line with expectations. Though slippages
remained high, on an absolute basis it was lower sequentially and large part of
Beta
1.8
that came from the watch list. While overall loan book growth remained
52 Week High / Low
298/181
moderate, domestic business remained decent and fee income gained traction.
Avg. Daily Volume
14,83,994
Run down in overseas book impacted the overall loan book: Overall loan growth
Face Value (`)
2
remained muted up 5.2% YoY, flat QoQ. However, the domestic loan book grew
BSE Sensex
28,352
by 12% YoY. The international book reported decline of 16.1% due to the maturity
Nifty
8,805
of FCNR linked advances to the tune of $870Mn. The domestic loan growth
Reuters Code
ICBK.BO
continued to be driven by the retail loan portfolio which grew by 17.8% YoY.Retail
Bloomberg Code
ICICIBC@IN
loans contribution to the overall growth has been increasing off late and has gone
up to 48.9% for the quarter, compared to 43.8% in same period last year.
Deposit growth were healthy backed by flows in CASA, due to demonetization:
Shareholding Pattern (%)
Deposits grew by 14.2% yoy, after considering redemption of FCNR linked
Promoters
0.0
deposits to the tune of $1.75Bn, including which the deposit growth would
MF / Banks / Indian Fls
31.0
have been 17%+. There was fresh accretion of CASA to the tune of
`26,700cr, implying CASA growth of 15.9% YoY and 3.9% QoQ, thus the
FII / NRIs / OCBs
63.0
CASA ratio improved to 49.8% for Q3FY17 vs 45.7% in Q2FY17.
Indian Public / Others
6.0
Rise in GNPAs was on expected line; Gross slippages for the quarters were at
`7,037cr (6.1% slippages ratio) vs `8,029cr (7.1%). Of the total slippages ~94%
Abs.(%)
3m 1yr 3yr
came from the corporate accounts and 71% of the corporate slippages were from
the watch list itself. Of the total slippages ~94% came from the corporate
Sensex
5.7
23.3
40.4
accounts and 71% of the corporate slippages were from the watch list itself.
ICICIB
1.7
45.1
43.5
Accordingly, the amount of loans put under watch list came down to `27,536 cr vs
`32,490cr. With the current rate we believe large part of the troubled accounts of
3-year price chart
the watch list should get over by FY18.
500
Outlook and valuation: While the near term outlook for ICICI Bank remains
400
challenging, the asset quality issues is gradually waning. The bank might choose
to grow slow as far as loan book is concerned which we believe is a right strategy.
300
At the current market price, the bank’s core banking business (after adjusting
200
`80/share towards the value of subsidiaries) is trading at 1.3x FY2018E ABV.
Though some pain in asset quality is likely to persist in the quarters to come, we
100
believe the current valuations remain decent for the bank and hence we have an
0
Accumulate rating on the stock, with a target price of `315.
Key financials (Standalone)
Y/E March (` cr)
FY2015
FY2016
FY2017E
FY2018E
Source: Company, Angel Research
NII
19,040
21,224
21,069
25,818
% chg
15.6
11.5
(0.7)
22.5
Net profit
11,176
9,726
10,160
11,748
% chg
13.9
(13.0)
4.5
15.6
NIM (%)
3.2
3.3
3.1
3.3
EPS (`)
19.3
16.7
17.4
20.2
P/E (x)
14.6
16.9
16.2
14.0
P/ABV (x)
2.2
2.2
2.0
1.9
Siddharth Purohit
RoA (%)
1.8
1.4
1.4
1.4
022 - 3935 7800 Ext: 6872
RoE (%)
14.5
11.4
10.5
10.8
Source: Company, Angel Research; Note: CMP as of February 13, 2017
Please refer to important disclosures at the end of this report
1
ICICI Bank | 3QFY2017 Result Update
Exhibit 1: 3QFY17 Income Statement ( Standalone)
Particulars (` cr)
Q1FY16
Q2FY16
Q3FY16
Q4FY16
Q1FY17
Q2FY17
Q3FY17
% YoY
% QoQ
Interest earned
12,813
13,099
13,346
13,482
13,330
13,639
13,618
2.0
(0.2)
- on Advances / Bills
9,375
9,665
9,863
10,041
9,837
9,905
9,870
0.1
(0.4)
- on investments
2,659
2,661
2,652
2,652
2,811
2,997
2,948
11.1
(1.6)
- on balance with RBI & others
32
31
36
59
50
38
126
246.6
231.0
- on others
747
741
795
730
632
699
675
(15.1)
(3.5)
Interest Expended
7,697
7,847
7,893
8,077
8,172
8,386
8,254
4.6
(1.6)
Net Interest Income
5,115
5,251
5,453
5,405
5,159
5,253
5,364
(1.6)
2.1
Other income
2,990
3,007
4,217
5,109
3,429
9,119
3,938
(6.6)
(56.8)
- Fee income
2,110
2,235
2,262
2,212
2,156
2,356
2,495
10.3
5.9
- Treasury income
673
550
513
707
505
5,682
-
(100.0)
(100.0)
- Others
207
222
1,442
2,190
768
729
893
(38.1)
22.5
Operating income
8,105
8,259
9,670
10,513
8,588
14,372
9,302
(3.8)
(35.3)
Operating expenses
3,067
3,100
3,110
3,406
3,373
3,736
3,778
21.5
1.1
- Employee expenses
1,267
1,213
1,140
1,382
1,291
1,556
1,406
23.3
(9.6)
- Other Opex
1,800
1,888
1,970
2,024
2,082
2,180
2,372
20.4
8.8
Pre-provision Profit
5,038
5,158
6,560
7,108
5,215
10,636
5,525
(15.8)
(48.1)
Provisions & Contingencies
955
942
2,844
6,926
2,515
7,082
2,713
(4.6)
(61.7)
PBT
4,082
4,216
3,716
181
2,700
3,554
2,812
(24.3)
(20.9)
Provision for Tax
1,106
1,186
698
(521)
446
451
369
(47.0)
(18.1)
PAT
2,976
3,030
3,018
(2,898)
2,254
3,103
2,442
(19.1)
(21.3)
Effective Tax Rate (%)
27
28
19
(287)
17
13
13
Source: Company, Angel Research
Exhibit 2: Loan Book Break Up
Particulars (` cr)
Q1FY16
Q2FY16
Q3FY16
Q4FY16
Q1FY17
Q2FY17
Q3FY17
% YoY
% QoQ
Domestic Corporate
1,14,725
1,16,353
1,25,222
1,19,698
1,27,637
1,25,829
1,29,921
3.8
3.3
Overseas branches
96,737
95,458
99,134
94,017
95,278
91,305
82,802
(16.5)
(9.3)
SME
17,189
17,617
20,001
18,716
17,977
19,533
21,044
5.2
7.7
Retail Total
1,71,088
1,80,265
1,90,442
2,02,833
2,08,534
2,17,588
2,23,703
17.5
2.8
-Home
93,927
99,326
1,04,553
1,09,530
1,13,234
1,18,150
1,22,142
16.8
3.4
-Vehicle loans
30,625
32,267
33,708
35,293
36,285
37,208
38,477
14.1
3.4
Rural
25,663
25,778
27,805
31,845
31,697
31,333
31,095
11.8
(0.8)
-Banking business
9,239
10,095
10,093
10,750
10,635
8,486
8,053
(20.2)
(5.1)
-Credit cards
4,106
4,507
5,142
5,476
5,839
6,092
7,158
39.2
17.5
-Personal loans
7,528
8,292
9,141
10,142
10,844
11,750
12,751
39.5
8.5
Others
4,569
4,027
-
-
Total advances
3,99,738
4,09,693
4,34,800
4,35,467
4,49,427
4,54,256
4,57,469
5.2
0.7
Source: Company, Angel Research
February 13, 2017
2
ICICI Bank | 3QFY2017 Result Update
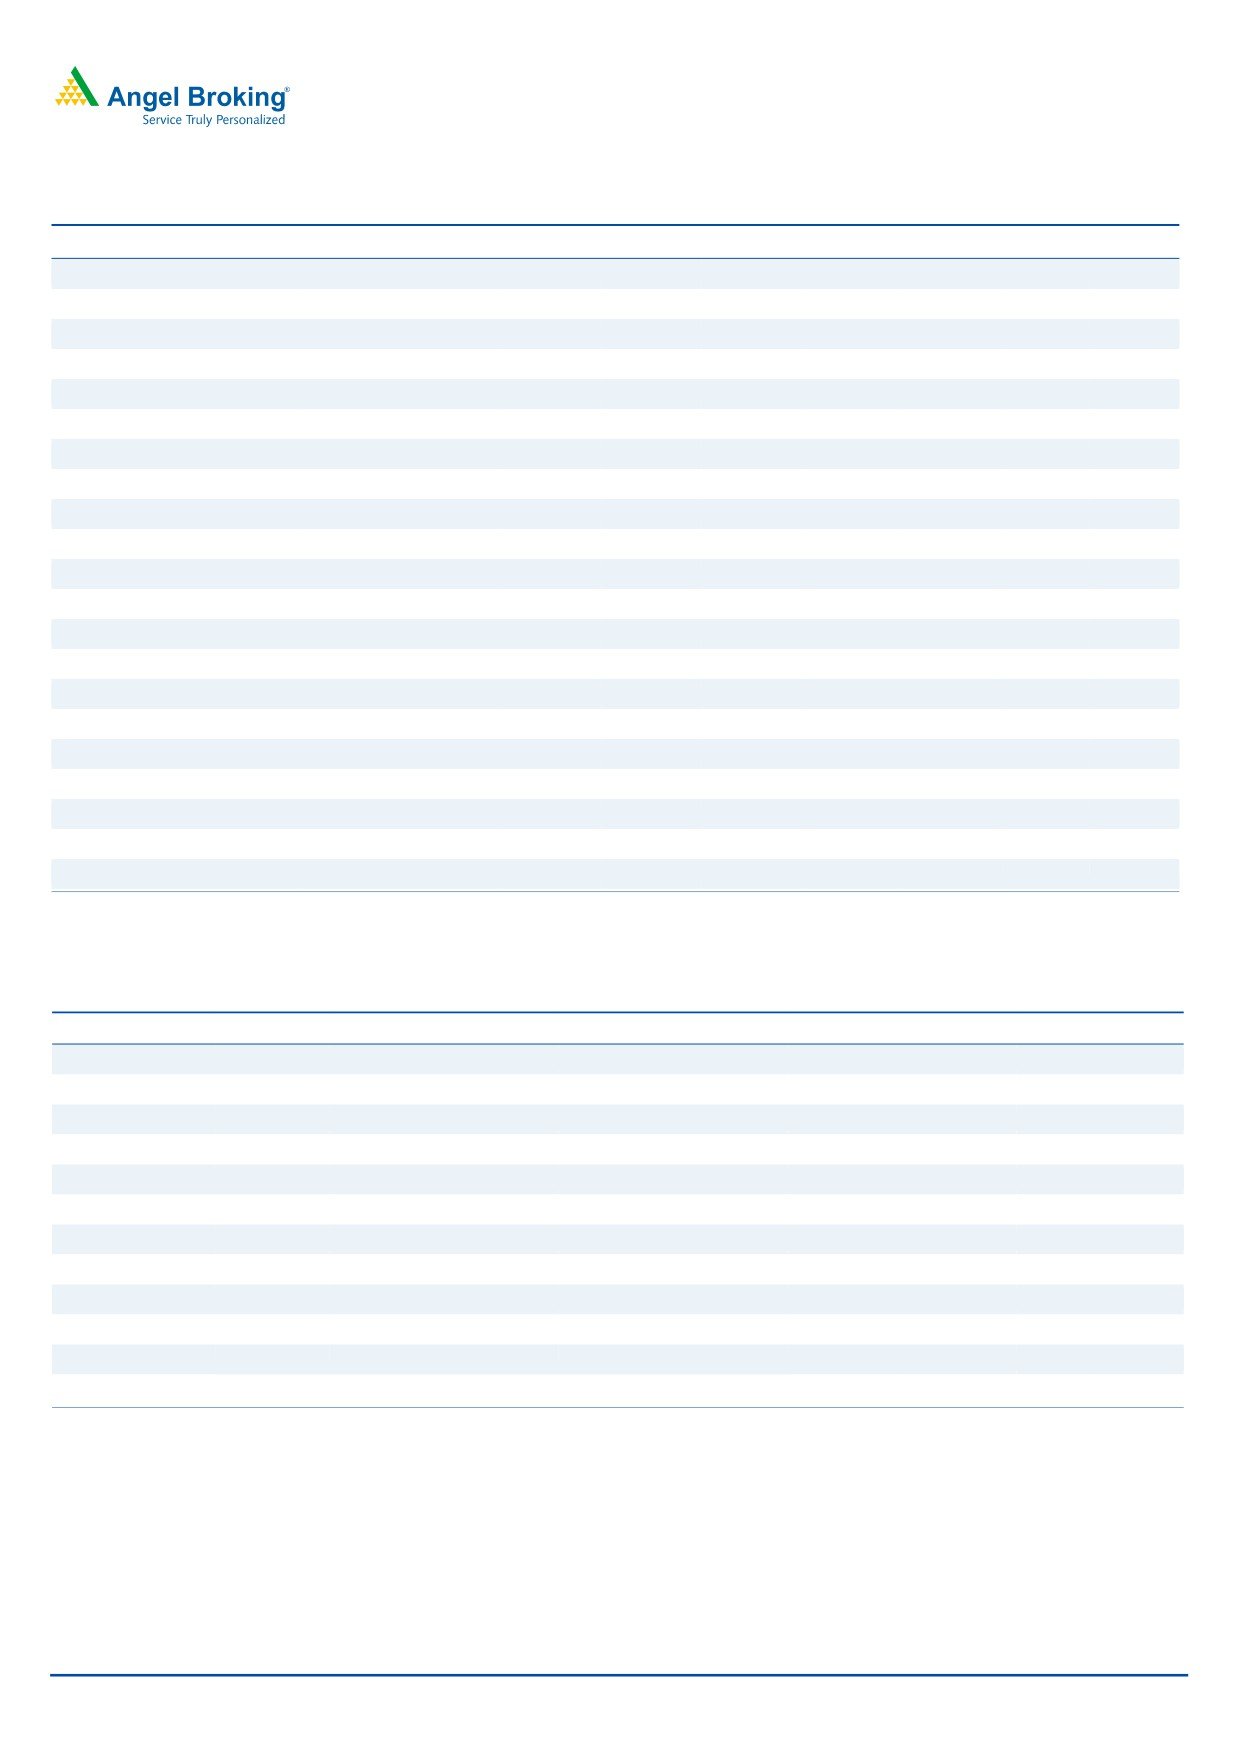
Domestic loan book grew at a healthy pace, run down in
overseas book impacted the overall loan book: Overall loan growth
remained muted up by only 5.2% YoY, and flat QoQ. However, the domestic loan
book grew by 12% YoY. The international book reported decline of 16.1% due to
the maturity of FCNR linked advances to the tune of $870Mn. The domestic loan
growth continued to be driven by the retail loan portfolio which grew by
17.8% YoY. However, the corporate loan book grew by a modest 4% as the
management remains focused and has been selective while lending to the large
corporates. SME portfolio also moderately grew by 6.6%.
Retail loans contribution to the overall growth has been increasing off late and has
gone up to 48.9% for the quarter, compared to 43.8% in same period last year.
Within the retail portfolio strong momentum was seen in the personal loans
segment up 39.9% and credit card business up 39.7%. With lower incremental
credit demand from corporates the growth will continue to be driven by the retail
segment for ICICI Bank in the quarters to come.
Deposit growth were healthy backed by flows in CASA, due to demonetization:
Deposits grew by 14.2% yoy, after considering redemption of FCNR linked
deposits to the tune of $1.75Bn, including which the deposit growth would have
been 17%+. There was fresh accretion of CASA to the tune of `26,700cr, implying
CASA growth of 15.9% YoY and 3.9% QoQ, thus the CASA ratio improved to
49.8% for Q3FY17 vs 45.7% in Q2FY17.
Exhibit 3: Loan Growth
Exhibit 4: CASA Growth trend
18.0
16.6
16.8
46.0
17.9
18.3
19.0
15.8
17.7
15.3
17.5
16.0
14.6
18.0
14.2
45.8
13.3
14.0
17.0
12.3
12.4
15.9
45.6
12.0
10.9
16.0
9.2
45.4
10.0
15.0
8.0
14.0
45.2
12.9
5.2
6.0
13.0
45.0
4.0
12.0
44.8
2.0
11.0
45.1
45.2
45.8
45.1
45.7
45.9
0.0
44.6
10.0
Q2FY16
Q3FY16
Q4FY16
Q1FY17
Q2FY17
Q3FY17
Q2FY16
Q3FY16
Q4FY16
Q1FY17
Q2FY17
Q3FY17
Loan Growth YoY (%) Deposit Growth YoY (%)
CASA Ratio (%)
YoY Growth (%)
Source: Company, Angel Research
Source: Company, Angel Research
February 13, 2017
3
ICICI Bank | 3QFY2017 Result Update
NII remained under pressure, while fee income supported bottom-line: NII
continued to be under pressure and declined by 1.6% yoy, which can be attributed
to the subdued loan growth and interest reversal due to slippages. After remaining
subdued in the previous few quarters, fee income picked up and grew by 10% and
traction in the fee income is expected to remain healthy in the quarters to come.
Retail fees grew by 18% YoY and retail fees contributed to 71% of the total fees.
Further credit cost remained under control for the quarter and this helped in PAT at
`2442cr, which though declined by
19% YoY, still was better than our
expectations. As slippages are expected to remain high in the quarters to come,
the NII will also be under pressure in the coming quarters.
Exhibit 5: NII Growth remained subdued
Exhibit 6: Fee Income growth picked up
5,500
16.0
2,600
12.0
5,450
14.0
13.3
2,500
12.8
10.3
10.0
5,400
12.0
5,350
10.0
2,400
7.2
8.0
5,300
8.0
2,300
5,250
6.4
6.0
6.3
6.0
2,200
5.4
5,200
4.0
5,150
2.0
4.0
2,100
3.5
0.8
5,100
0.0
0.0
2.2
2.0
-1.
6
2,000
5,050
-2.0
5,000
-4.0
1,900
0.0
Q2FY16
Q3FY16
Q4FY16
Q1FY17
Q2FY17
Q3FY17
Q2FY16
Q3FY16
Q4FY16
Q1FY17
Q2FY17
Q3FY17
NII (` Cr)
% YoY Growth
Fee Income (` Cr)
YoY Growth (%)
Source: Company, Angel Research
Source: Company, Angel Research
February 13, 2017
4
ICICI Bank | 3QFY2017 Result Update
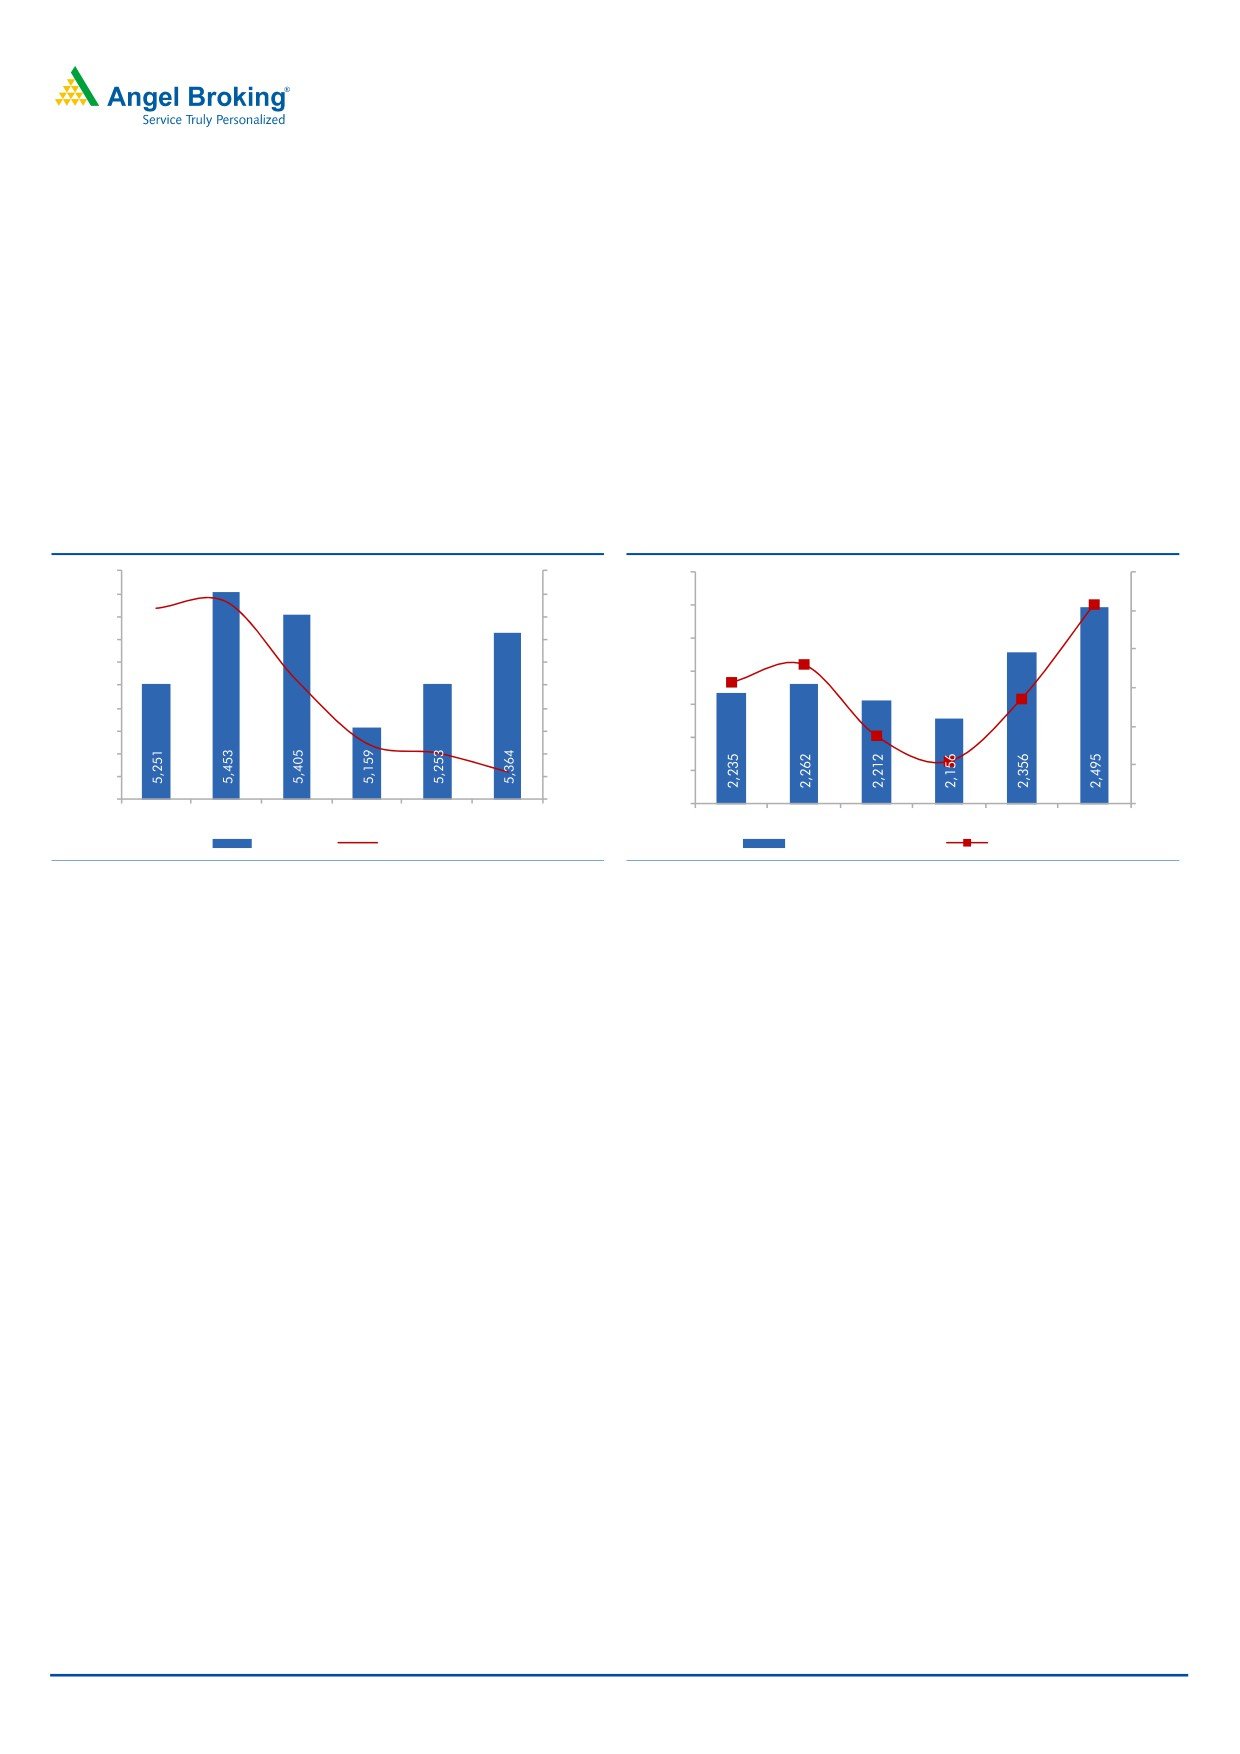
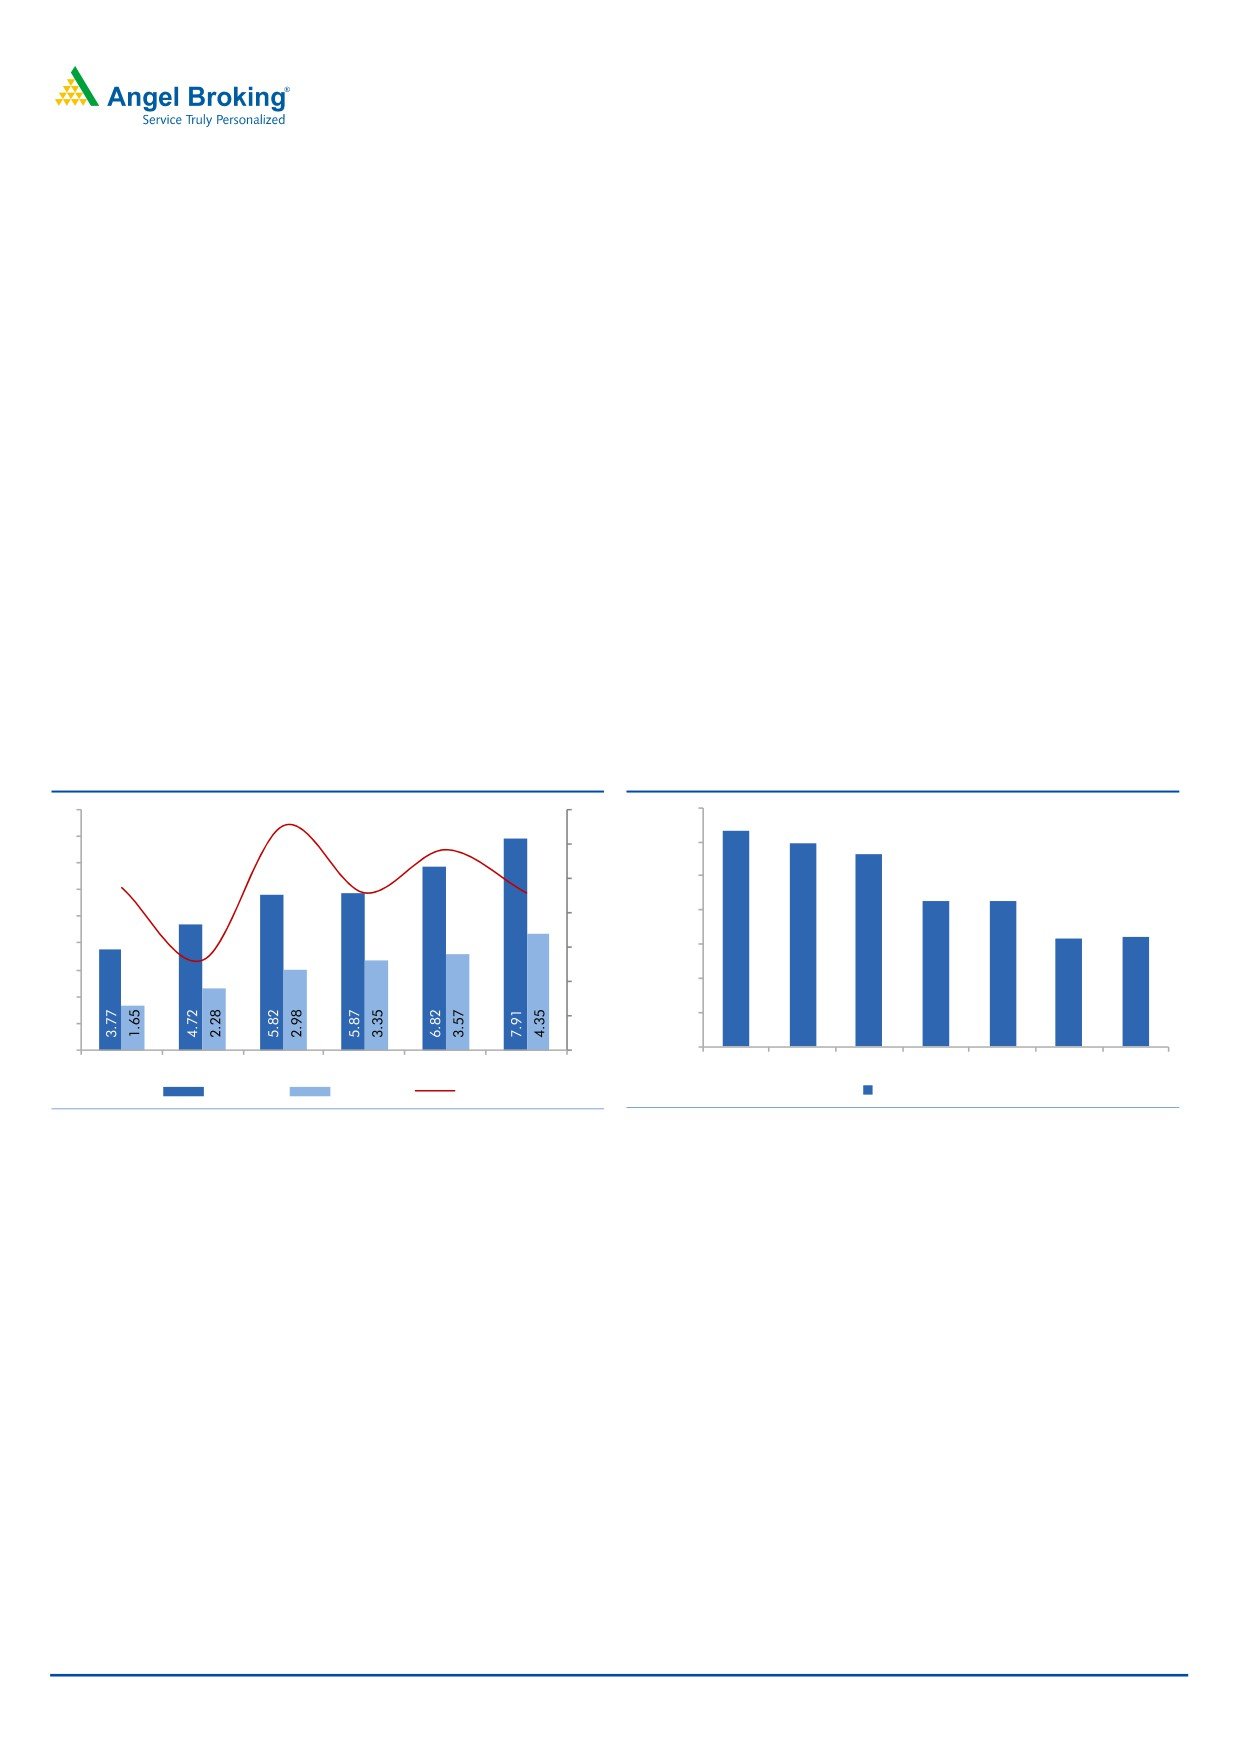
Rise in GNPAs was on expected line: The GNPAs went up by 17% QoQ to
`37,716cr and GNPAs % went up by 110 bps to 7.91%. However, the rise in
GNPAs was on the expected line. As indicated by the management earlier large
part of the slippages came from the list of accounts put under watch. Gross
slippages for the quarters were at `7,037cr (6.1% slippages ratio) vs `8,029cr
(7.1%). Of the total slippages ~94% came from the corporate accounts and 71%
of the corporate slippages were from the watch list itself. Accordingly, the amount
of loans put under watch list came down to `27,536cr vs `32,490cr.
With the current rate we believe large part of the troubled accounts of the watch list
should get over by FY18. While absolute slippages could remain high, the good
part is that only 24% of the total slippages were from the non-watch list corporate
accounts while the large part continued to come from the watch list, which
indicates that the trouble of asset quality remains restricted to the watch list.
Couple of mid-sized accounts got restructured during the quarter and outstanding
restructured loan book inched up marginally to `6,407 cr. Outstanding SDR loans
stood at `3,400 cr , of which `2,800 cr from NPAs, while outstanding 5:25 stood
at `3,300 cr, of which `2400 cr were from loans under watch list.
Exhibit 7: GNNPAs & NNPAs went up
Exhibit 8: Restructured loan book remained stable
9
62
14,000
12,604
61.0
11,868
8
11,294
60
12,000
59.6
7
57.4
58
10,000
8,573
8,573
6
57.1
57.1
56
8,000
5
6,336
6,407
4
54
6,000
53.2
3
52
4,000
2
50
2,000
1
0
48
-
Q2FY16
Q3FY16
Q4FY16
Q1FY17
Q2FY17
Q3FY17
Q1FY16
Q2FY16
Q3FY16
Q4FY16
Q1FY17
Q2FY17
Q3FY17
GNPAs %
NNPAs %
PCR %
O/S Restrctured Book
Source: Company, Angel Research
Source: Company, Angel Research
February 13, 2017
5
ICICI Bank | 3QFY2017 Result Update
Outlook and Valuation
While the near term outlook for ICICI Bank remains challenging, the asset quality
issues is gradually waning. The bank might choose to grow slow as far as loan
book is concerned which we believe is a right strategy. At the current market price,
the bank’s core banking business (after adjusting `80/share towards the value of
subsidiaries) is trading at 1.3x FY2018E ABV. Though some pain in asset quality is
likely to persist in the quarters to come, we believe the current valuations remain
decent for the bank and hence we have an Accumulate rating on the stock, with a
target price of `315.
Exhibit 9: SOTP valuation summary
Particulars
Target multiple Value/share (`)
ICICI Bank
1.6x FY2018E ABV
229
Life Insurance
Based on Market Price
40
General Insurance
Based On Deal Value
21
Others (Home Fin, AMC, VC, Securities
25
PD and Overseas subsidiaries)
SOTP value
315
Source: Angel Research
Company Background
ICICI Bank is India's largest private sector bank, with ~ 5% market share in credit.
The bank has a pan-India extensive network of 4,504 branches and around
14,146 ATMs. The bank has a large overseas presence (overseas loans comprise
~18.1% of total loans). The bank also has market-leading subsidiaries in life
insurance, general insurance and asset management segments.
February 13, 2017
6
ICICI Bank | 3QFY2017 Result Update
Income statement (Standalone)
Y/E March (` cr)
FY13
FY14
FY15
FY16
FY17E
FY18E
Net Interest Income
13,866
16,476
19,040
21,224
21,069
25,818
- YoY Growth (%)
29.2
18.8
15.6
11.5
(0.7)
22.5
Other Income
8,346
10,428
12,176
15,323
20,737
16,175
- YoY Growth (%)
11.2
24.9
16.8
25.8
35.3
-22.0
Operating Income
22,212
26,903
31,216
36,547
41,805
41,993
- YoY Growth (%)
21.8
21.1
16.0
17.1
14.4
0.4
Operating Expenses
9,013
10,309
11,496
12,684
14,575
16,536
- YoY Growth (%)
14.8
14.4
11.5
10.3
14.9
13.5
Pre - Provision Profit
13,199
16,595
19,720
23,863
27,230
25,457
- YoY Growth (%)
27.1
25.7
18.8
21.0
14.1
(6.5)
Prov. & Cont.
1,803
2,626
3,900
11,668
15,213
8,053
- YoY Growth (%)
13.9
45.7
48.5
199.2
30.4
(47.1)
Profit Before Tax
11,397
13,968
15,820
12,196
12,016
17,404
- YoY Growth (%)
29.5
22.6
13.3
(22.9)
(1.5)
44.8
Prov. for Taxation
3,071
4,158
4,644
2,469
1,857
5,656
- as a % of PBT
26.9
29.8
29.4
20.2
15.5
32.5
PAT
8,325
9,810
11,176
9,726
10,160
11,748
- YoY Growth (%)
28.8
17.8
13.9
(13.0)
4.5
15.6
Balance sheet (Standalone)
Y/E March (` cr)
FY13
FY14
FY15
FY16
FY17E
FY18E
Share Capital
1,154
1,155
1,160
1,163
1,165
1,165
Reserve & Surplus
65,552
72,052
79,262
88,566
1,03,455
1,11,678
Deposits
2,92,614
3,31,914
3,61,563
4,21,426
4,74,590
5,47,221
- Growth (%)
14.5
13.4
8.9
16.6
12.6
15.3
Borrowings
1,45,341
1,54,759
1,72,417
1,74,807
1,66,106
2,07,944
- Growth (%)
3.7
6.5
11.4
1.4
-5.0
25.2
Other Liab. & Prov.
32,134
34,756
31,720
34,726
37,967
49,250
Total Liabilities
5,36,795
5,94,642
6,46,129
7,20,688
7,83,283
9,17,258
Cash in Hand and with
19,053
21,822
25,653
27,106
28,475
32,833
RBI
Bal.with banks & money
22,365
19,708
16,652
32,763
20,170
23,257
at call
Investments
1,71,394
1,77,022
1,86,580
1,60,412
1,89,005
2,37,877
Advances
2,90,249
3,38,703
3,87,522
4,35,264
4,71,194
5,45,930
- Growth (%)
14.4
16.7
14.4
12.3
8.3
15.9
Fixed Assets
4,647
4,678
4,726
7,577
6,882
7,935
Other Assets
29,087
32,709
24,997
57,567
67,557
69,426
Total Assets
5,36,795
5,94,642
6,46,129
7,20,688
7,83,283
9,17,258
February 13, 2017
7
ICICI Bank | 3QFY2017 Result Update
Ratio analysis (Standalone)
Y/E March
FY13
FY14
FY15
FY16
FY17E
FY18E
Profitability ratios (%)
NIMs
2.9
3.1
3.2
3.3
3.1
3.3
Cost to Income Ratio
40.6
38.3
36.8
34.7
34.9
39.4
RoA
1.6
1.7
1.8
1.4
1.4
1.4
RoE
13.1
14.0
14.5
11.4
10.5
10.8
B/S ratios (%)
CASA Ratio
41.9
42.9
45.5
45.8
45.9
46.1
Credit/Deposit Ratio
99.2
102.0
107.2
103.3
99.3
99.8
CAR
18.7
17.7
17.0
16.6
16.8
15.8
- Tier I
5.9
4.9
4.2
3.5
3.4
3.1
Asset Quality (%)
Gross NPAs
3.2
3.0
3.8
5.8
7.4
6.7
Net NPAs
0.6
1.0
1.6
3.0
4.6
4.5
Slippages
1.4
1.7
2.4
4.4
3.7
2.6
Loan Loss Prov. /Avg. Assets
0.6
0.8
1.0
2.7
3.2
1.5
Provision Coverage
76.8
70.4
59.1
50.3
52.0
52.5
Per Share Data (`)
EPS
14.4
17.0
19.3
16.7
17.4
20.2
ABVPS
111.8
121.1
127.9
129.5
142.2
151.7
DPS
4.0
4.4
4.8
5.0
5.0
6.0
Valuation Ratios
PER (x)
19.5
16.6
14.6
16.9
16.2
14.0
P/ABVPS (x)
2.5
2.3
2.2
2.2
2.0
1.9
Dividend Yield
1.4
1.6
1.7
1.8
1.8
2.1
DuPont Analysis
NII
2.7
2.9
3.1
3.1
2.8
3.0
(-) Prov. Exp.
1.6
1.8
2.0
2.2
2.8
1.9
Adj NII
4.3
4.8
5.0
5.3
5.6
4.9
Other Inc.
1.8
1.8
1.9
1.9
1.9
1.9
Op. Inc.
2.6
2.9
3.2
3.5
3.6
3.0
Opex
0.4
0.5
0.6
1.7
2.0
0.9
PBT
2.2
2.5
2.6
1.8
1.6
2.0
Taxes
0.6
0.7
0.7
0.4
0.2
0.7
ROA
1.6
1.7
1.8
1.4
1.4
1.4
Leverage
8.1
8.1
8.1
8.0
7.7
7.8
RoE
13.1
14.0
14.5
11.4
10.5
10.8
February 13, 2017
8
ICICI Bank | 3QFY2017 Result Update
Research Team Tel: 022 - 39357800
DISCLAIMER
Angel Broking Private Limited (hereinafter referred to as “Angel”) is a registered Member of National Stock Exchange of India Limited,
Bombay Stock Exchange Limited and Metropolitan Stock Exchange Limited. It is also registered as a Depository Participant with CDSL
and Portfolio Manager with SEBI. It also has registration with AMFI as a Mutual Fund Distributor. Angel Broking Private Limited is a
registered entity with SEBI for Research Analyst in terms of SEBI (Research Analyst) Regulations, 2014 vide registration number
INH000000164. Angel or its associates has not been debarred/ suspended by SEBI or any other regulatory authority for accessing
/dealing in securities Market. Angel or its associates/analyst has not received any compensation / managed or co-managed public
offering of securities of the company covered by Analyst during the past twelve months.
This document is solely for the personal information of the recipient, and must not be singularly used as the basis of any investment
decision. Nothing in this document should be construed as investment or financial advice. Each recipient of this document should
make such investigations as they deem necessary to arrive at an independent evaluation of an investment in the securities of the
companies referred to in this document (including the merits and risks involved), and should consult their own advisors to determine
the merits and risks of such an investment.
Reports based on technical and derivative analysis center on studying charts of a stock's price movement, outstanding positions and
trading volume, as opposed to focusing on a company's fundamentals and, as such, may not match with a report on a company's
fundamentals. Investors are advised to refer the Fundamental and Technical Research Reports available on our website to evaluate the
contrary view, if any.
The information in this document has been printed on the basis of publicly available information, internal data and other reliable
sources believed to be true, but we do not represent that it is accurate or complete and it should not be relied on as such, as this
document is for general guidance only. Angel Broking Pvt. Limited or any of its affiliates/ group companies shall not be in any way
responsible for any loss or damage that may arise to any person from any inadvertent error in the information contained in this report.
Angel Broking Pvt. Limited has not independently verified all the information contained within this document. Accordingly, we cannot
testify, nor make any representation or warranty, express or implied, to the accuracy, contents or data contained within this document.
While Angel Broking Pvt. Limited endeavors to update on a reasonable basis the information discussed in this material, there may be
regulatory, compliance, or other reasons that prevent us from doing so.
This document is being supplied to you solely for your information, and its contents, information or data may not be reproduced,
redistributed or passed on, directly or indirectly.
Neither Angel Broking Pvt. Limited, nor its directors, employees or affiliates shall be liable for any loss or damage that may arise from
or in connection with the use of this information.
Disclosure of Interest Statement
ICICI Bank
1. Financial interest of research analyst or Angel or his Associate or his relative
No
2. Ownership of 1% or more of the stock by research analyst or Angel or associates or relatives
No
3. Served as an officer, director or employee of the company covered under Research
No
4. Broking relationship with company covered under Research
No
Ratings (Based on expected returns
Buy (> 15%)
Accumulate (5% to 15%)
Neutral (-5 to 5%)
over 12 months investment period):
Reduce (-5% to -15%)
Sell (< -15)
February 13, 2017
9